Climate intelligence for every infrastructure decision.
Infrastructure performance is being reshaped. We quantify the impact - yield, damage costs, adaptation ROI - asset by asset, in 48 hours.
Due Diligence · Acquisition Target
Trusted by leading European infrastructure companies


£14M. That's what the market missed in a single wind acquisition. Buyer paid £48M. Climate-corrected fair value: £62M. IRR from 8% to 15% - 700 basis points from better data alone.
That's what climate intelligence looks like in your DCF.
See the risk. Price what remains.
Most climate tools stop at gross exposure. We go four steps further - to the financial decision that changes how you price, hold, and adapt.
Climate Signals
Scenarios · Hazards
1950 - 2100 · P10-P90
Operational Impact
Vulnerability · Damage
Yield & revenue impact
Adaptation & Pricing
CapEx + payback
Insurance · Net position
Financial Decision
IRR impact Investors
Yield-adjusted revenue Renewables
Avoided costs & SAIDI Grids
Climate Signals
Scenarios · Hazards · 1950-2100
Operational Impact
Vulnerability · Damage · Yield
Adaptation & Pricing
CapEx · Insurance · Net position
Financial Decision
IRR impact Investors
Yield-adjusted revenue Renewables
Avoided costs & SAIDI Grids
Your deliverable, your format. Multi-currency (EUR, GBP, USD). Whatever fits your workflow.
48 MW Onshore Wind · Northern England
A ROC-accredited wind farm was on the market at £48M. Standard technical due diligence used backward-looking weather data and assumed 15%/yr insurance cost escalation.
Repath's forward-looking climate intelligence corrected both assumptions: yield trend shifted from -0.40%/yr to +0.46%/yr, and insurance escalation dropped to 3%/yr with the right adaptation measures. The result: £14M of embedded value the market was missing.
Average wind yield deviation from P50 in climate-stressed regions by 2035
Increase in flood damage costs for European infrastructure over the past decade
Of infrastructure investors say climate risk is not yet reflected in their asset valuations
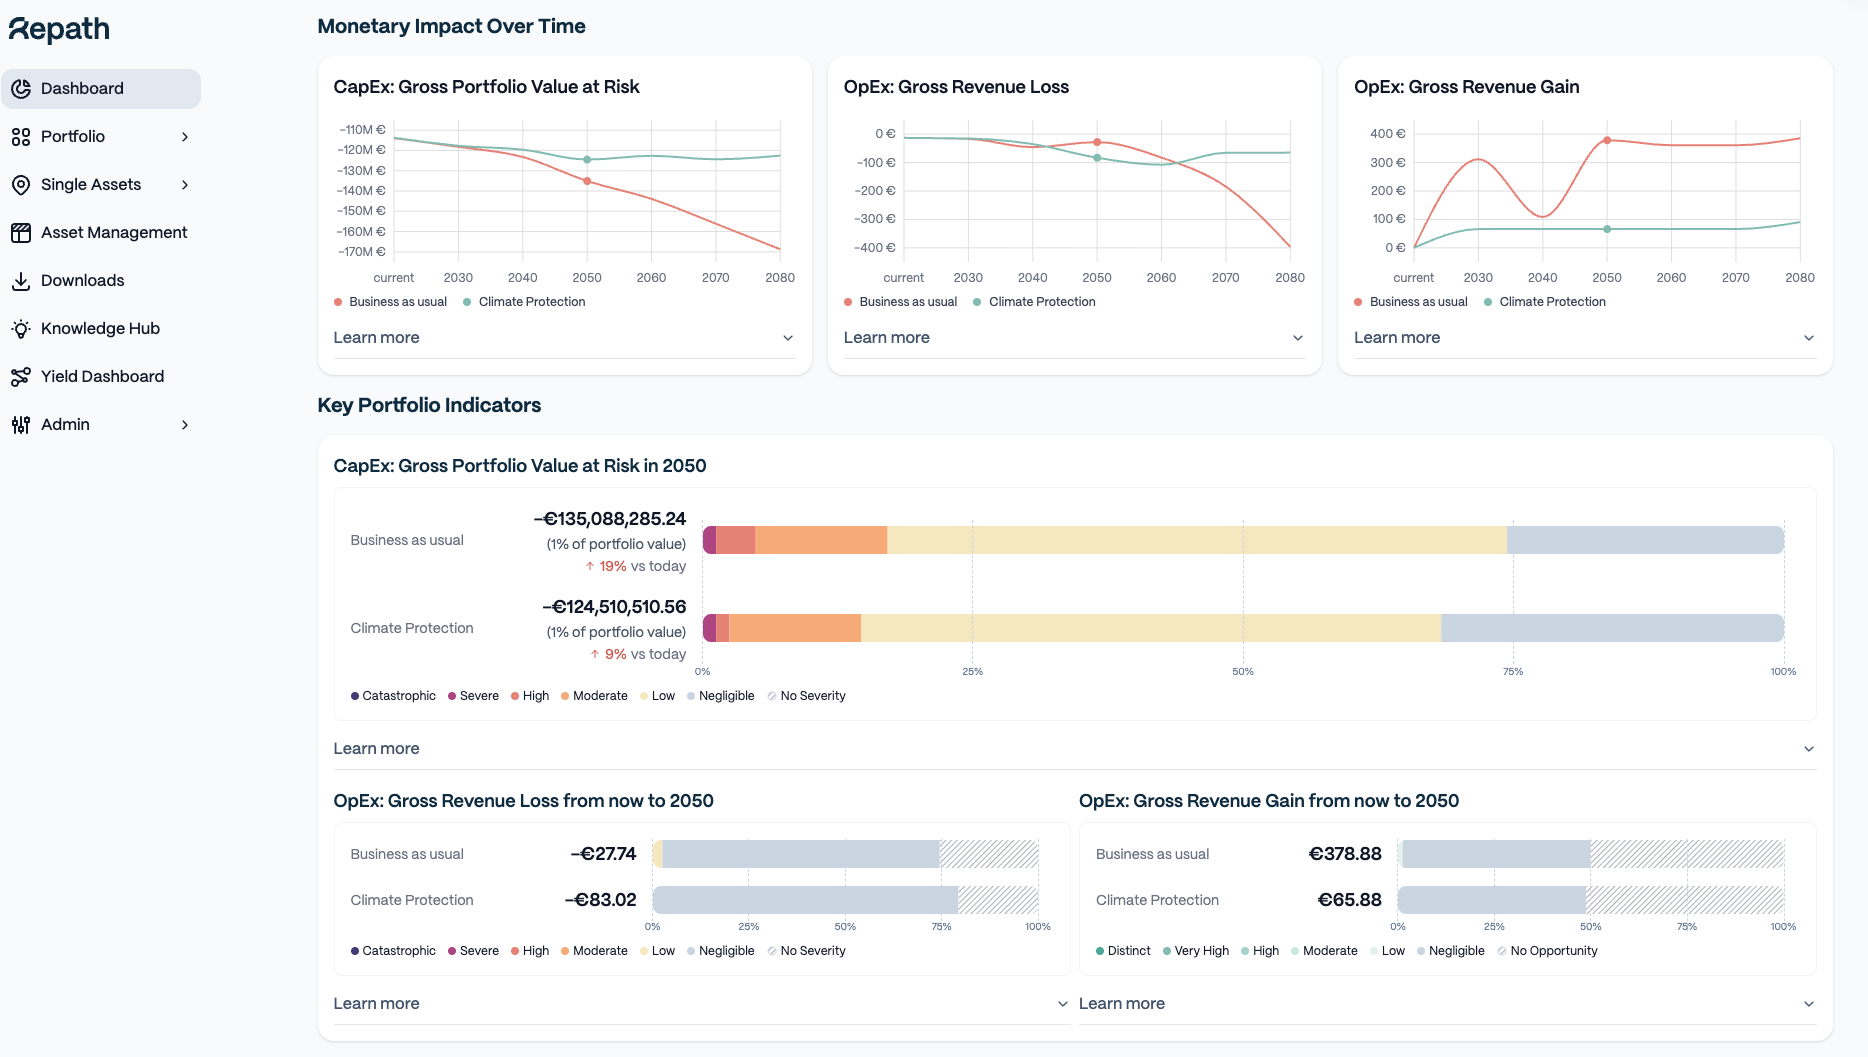
What is climate doing to infrastructure performance?
Every deal has unpriced climate exposure. That's not a problem - it's an opportunity. The investors who quantify it first find the mispriced assets.
How do you get from asset data to financial answers?
Send us your assets
Asset locations, types, and technical specs. Any format.
We model the climate impact
400 climate simulations meet asset-level financial modelling.
You get financial answers
Yield impact, damage costs, adaptation ROI. In 48 hours.
Example
132 kV substation - Northern Spain
more flood events by 2050
projected annual downtime cost
loss reduction for €180k CapEx
Who is this built for?
The people who own, operate, and finance infrastructure.

GPs, Article 9 Funds, IPPs
Better portfolio diversification. Better deal pricing. Climate intelligence for every stage of the investment lifecycle.
Request a Deal Pack →

Wind & Solar Operators
Climate-adjusted yield intelligence for your portfolio.
Get Your Yield Analysis →

TSOs & DSOs
Prioritise adaptation investment where it prevents the most outages.
Talk to Our Infrastructure Team →
See what climate does to your assets.
Tell us your asset type and location. We'll send you a climate exposure analysis - yield impact, damage costs, adaptation options.
What makes Repath different?
400 climate simulations. Component-level engineering. One financial answer.
Machine learning-enhanced downscaling translates global climate models to individual asset locations - matching each site's elevation, exposure, and microclimate. Not a regional average.
EUR impact on yield, damage costs, adaptation ROI. AI-generated narrative summaries explain results in the language your investment committee expects - not a colour-coded matrix you have to interpret.
IPCC scenarios to 2050 and beyond. Historical data tells you what happened. We tell you what's coming.
Dashboard, PDF report, Excel, or direct API integration into your existing systems. No new tools to learn - the climate intelligence plugs into the workflows you already use.
Latest insights
All articles →See what climate is doing to your assets.
Send us your portfolio. We'll send you the climate intelligence - in 48 hours.
48h to DCF-ready results · Any asset class · Any format